Lecture 19
November 24, 2025
Pros:
Cons:
Challenges include:
Most optimization frameworks implicitly assume perfect specifications of:
It ain’t what you don’t know that gets you into trouble. It’s what you know for sure that just ain’t so.
– Often attributed to Mark Twain (apocryphal)
If we know something about probabilities: Monte Carlo or decision trees…
What if we don’t?
How high do you think CO2 emissions be in 2100?

Text: VSRIKRISH to 22333
Future CO2 emissions are dependent on multiple factors which are difficult to forecast:
When there is no consensus probability for an uncertainty, we refer to it as a deep uncertainty.
Reports that say that something hasn’t happened are always interesting to me, because as we know, there are known knowns; there are things we know we know. We also know there are known unknowns; that is to say we know there are some things we do not know. But there are also unknown unknowns — the ones we don’t know we don’t know. And if one looks throughout the history of our country and other free countries, it is the latter category that tends to be the difficult ones.
– Donald Rumsfeld, 2002 (emphasis mine)

We can test the extent to which these different assumptions matter using sensitivity analyses.
Many parts of a systems-analysis workflow involve potentially large numbers of modeling assumptions, or factors:
Additional factors increase computational expense and analytic complexity.

Source: Saltelli et al (2019)
Sensitivity analysis is…
the study of how uncertainty in the output of a model (numerical or otherwise) can be apportioned to different sources of uncertainty in the model input
— Saltelli et al (2004), Sensitivity Analysis in Practice

Source: Reed et al (2022)
Which factors have the greatest impact on output variability?

Source: Reed et al (2022)
Which factors have negligible impact and can be fixed in subsequent analyses?

Source: Reed et al (2022)
Which values of factors lead to model outputs in a certain output range?

Source: Reed et al (2022)
We’ve seen one example of a quantified sensitivity before: the shadow price of an LP constraint.
The shadow price expresses the objective’s sensitivity to a unit relaxation of the constraint.
x1 = 0:1200
x2 = 0:1400
f1(x) = (600 .- 0.9 .* x) ./ 0.5
f2(x) = 1000 .- x
f3(x) = (650 .- 0.9 .* x) ./ 0.5
p = plot(0:667, min.(f1(0:667), f2(0:667)), fillrange=0, color=:lightblue, grid=true, label="Feasible Region", xlabel=L"x_1", ylabel=L"x_2", xlims=(-50, 1200), ylims=(-50, 1400), framestyle=:origin, minorticks=4, right_margin=4mm, left_margin=4mm, legendfontsize=14, tickfontsize=16, guidefontsize=16)
plot!(0:667, f1.(0:667), color=:brown, linewidth=3, label=false)
plot!(0:1000, f2.(0:1000), color=:red, linewidth=3, label=false)
annotate!(400, 1100, text(L"0.9x_1 + 0.5x_2 = 600", color=:purple, pointsize=18))
annotate!(1000, 300, text(L"x_1 + x_2 = 1000", color=:red, pointsize=18))
plot!(size=(1200, 600))
Z(x1,x2) = 230 * x1 + 120 * x2
contour!(0:660,0:1000,(x1,x2)->Z(x1,x2), levels=5, c=:devon, linewidth=2, colorbar = false, clabels = true)
scatter!(p, [0, 0, 667, 250], [0, 1000, 0, 750], markersize=10, z=2, label="Corner Point", markercolor=:orange)
plot!(0:667, f3.(0:667), color=:brown, linewidth=3, label=false, linestyle=:dash)Sorting by Shadow Price ⇄ 
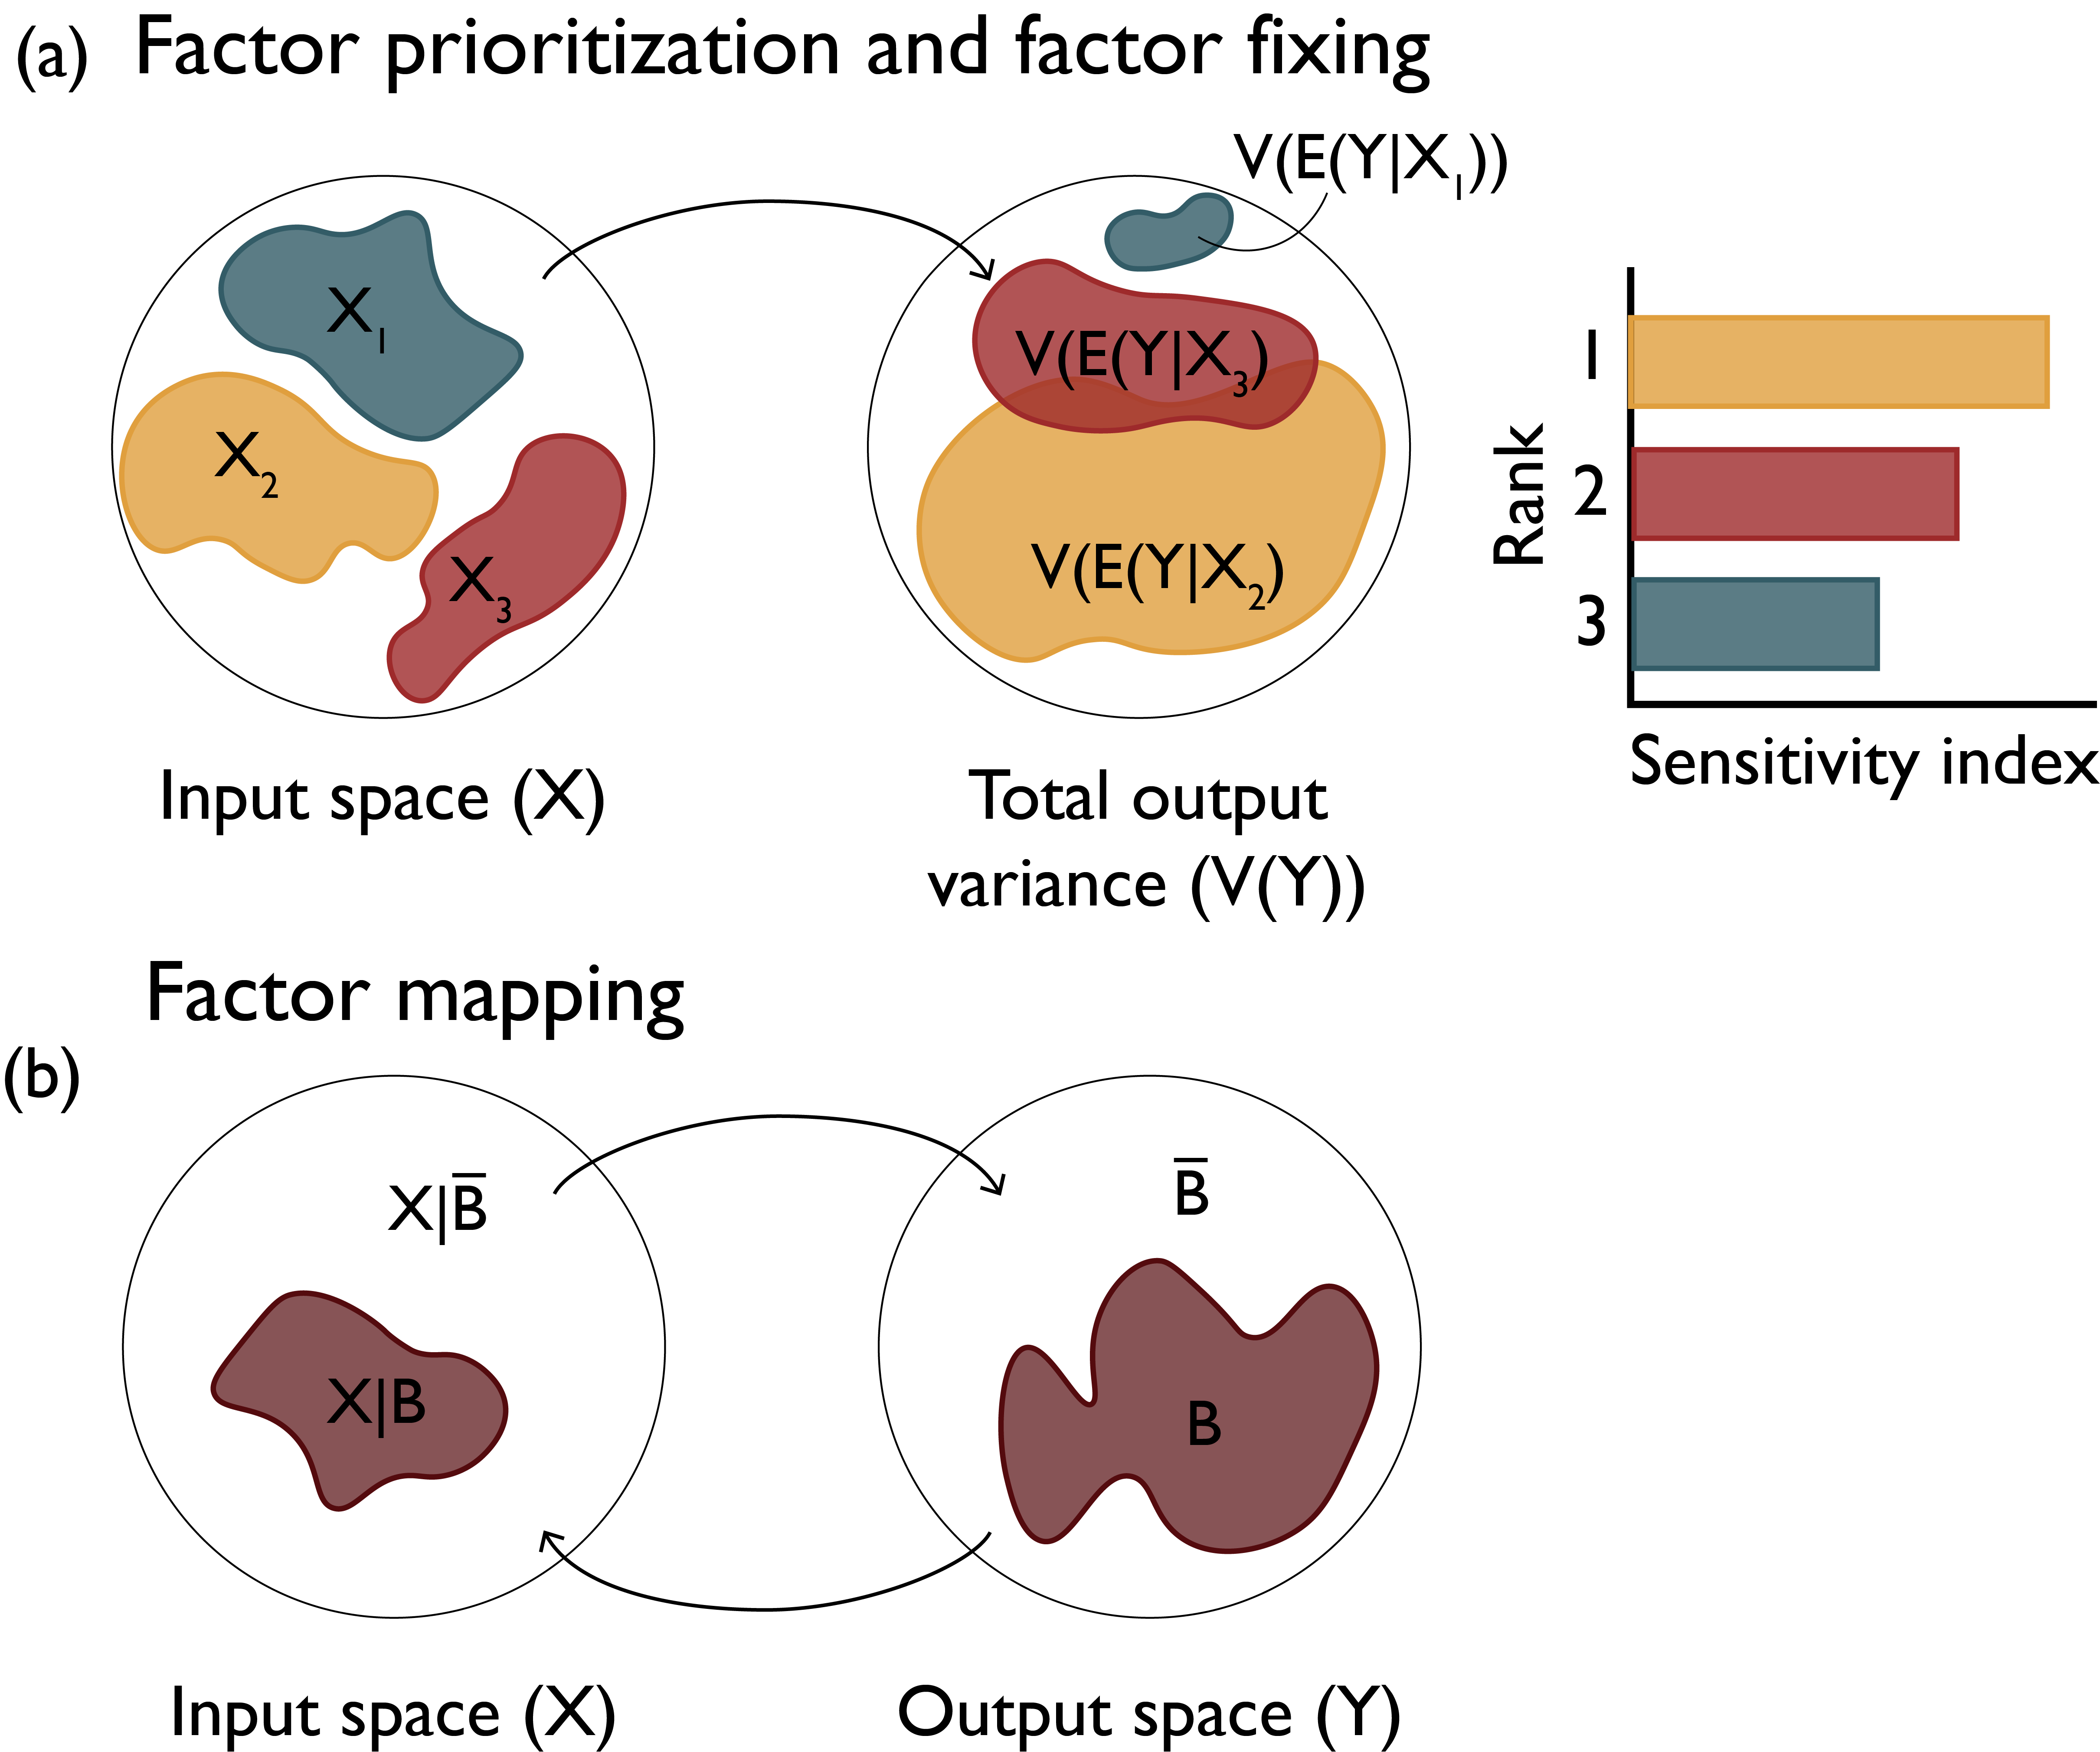
Factor Prioritization
Keeping Constraints With Low Shadow Prices Fixed ⇄ Factor Fixing
Assumption: Factors are linearly independent (no interactions).
Benefits: Easy to implement and interpret.
Limits: Ignores potential interactions.
Number of different sampling strategies: full factorial, Latin hypercubes, more.
Benefits: Can capture interactions between factors.
Challenges: Can be computationally expensive, does not reveal where key sensitivities occur.
Local sensitivities: Pointwise perturbations from some baseline point.
Challenge: Which point to use?
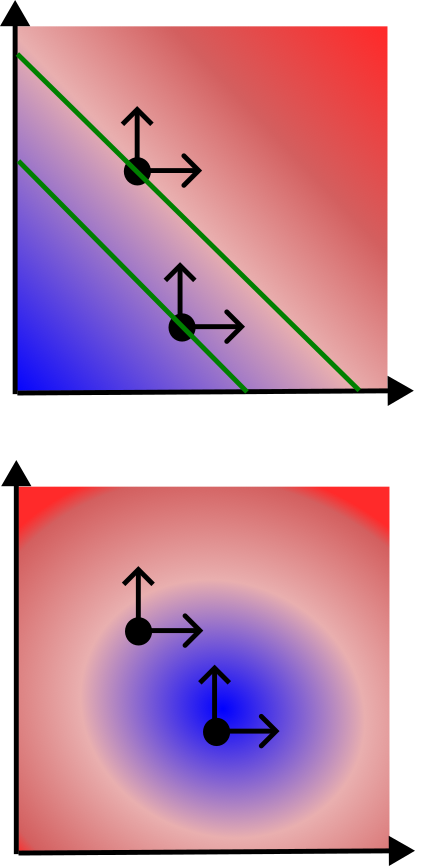
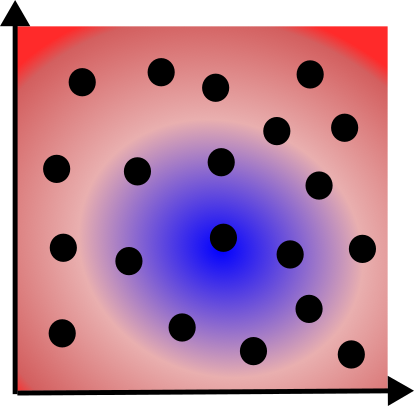
Global sensitivities: Sample throughout the space.
Challenge: How to measure global sensitivity to a particular output?
Advantage: Can estimate interactions between parameters


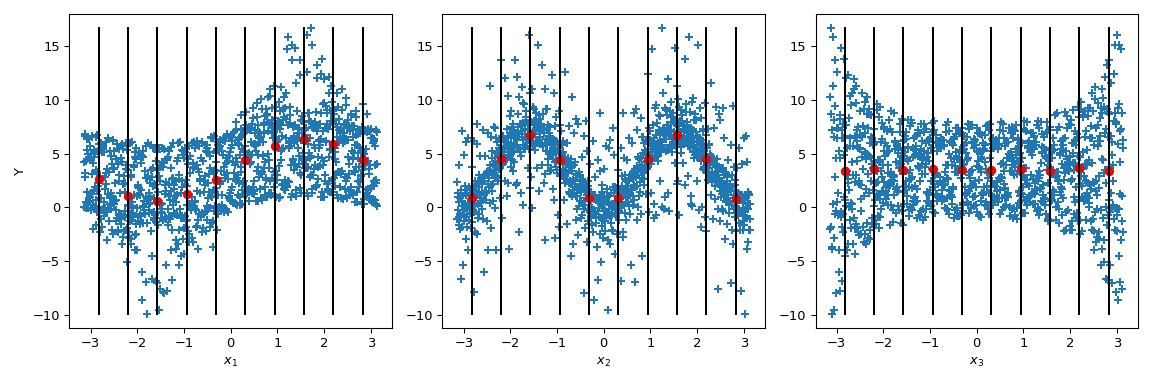
Source: SciPy Documentation
Number of approaches. Some examples:
For a fixed release strategy, look at how different parameters influence reliability.
Take \(a_t=0.03\), and look at the following parameters within ranges:
| Parameter | Range |
|---|---|
| \(q\) | \((2, 3)\) |
| \(b\) | \((0.3, 0.5)\) |
| \(ymean\) | \((\log(0.01), \log(0.07))\) |
| \(ystd\) | \((0.01, 0.25)\) |
The Method of Morris is an elementary effects method.
This is a global, one-at-a-time method which averages effects of perturbations at different values \(\bar{x}_i\):
\[S_i = \frac{1}{r} \sum_{j=1}^r \frac{f(\bar{x}^j_1, \ldots, \bar{x}^j_i + \Delta_i, \bar{x}^j_n) - f(\bar{x}^j_1, \ldots, \bar{x}^j_i, \ldots, \bar{x}^j_n)}{\Delta_i}\]
where \(\Delta_i\) is the step size.
function lake(a, y, q, b, T)
X = zeros(T+1, size(y, 2))
# calculate states
for t = 1:T
X[t+1, :] = X[t, :] .+ a[t] .+ y[t, :] .+ (X[t, :].^q./(1 .+ X[t, :].^q)) .- b.*X[t, :]
end
return X
end
function lake_sens(params)
Random.seed!(1)
T = 100
nsamp = 1000
q = params[1]
b = params[2]
ymean = params[3]
ystd = params[4]
lnorm = LogNormal(ymean, ystd)
y = rand(lnorm, (T, nsamp))
crit(x) = (x^q/(1+x^q)) - b*x
Xcrit = find_zero(crit, 0.5)
X = lake(0.03ones(T), y, q, b, T)
rel = sum(X[T+1, :] .<= Xcrit) / nsamp
return rel
end
Random.seed!(1)
s = gsa(lake_sens, Morris(),
[(2, 3), (0.3, 0.5), (log(0.01), log(0.07)),
(0.01, 0.25)])
p1 = bar([L"$q$", L"$b$", "ymean", "ystd"], (abs.(s.means) .+ 0.01)', legend=false, title="Sensitivity Index Means")
p2 = bar([L"$q$", L"$b$", "ymean", "ystd"], (s.variances .+ 0.01)', legend=false, yaxis=:log, title="Sensitivity Index Variances")
plot(p1, p2, layout=(2,1), size=(1200, 600))The Sobol method is a variance decomposition method, which attributes the variance of the output into contributions from individual parameters or interactions between parameters.
\[S_i^1 = \frac{Var_{x_i}\left[E_{x_{\sim i}}(x_i)\right]}{Var(y)}\]
\[S_{i,j}^2 = \frac{Var_{x_{i,j}}\left[E_{x_{\sim i,j}}(x_i, x_j)\right]}{Var(y)}\]
samples = 1_000
sampler = SobolSample()
lb = [2, 0.3, log(0.01), 0.01]
ub = [3, 0.5, log(0.07), 0.25]
A, B = QuasiMonteCarlo.generate_design_matrices(samples, lb, ub, sampler)
s = gsa(lake_sens, Sobol(order=[0, 1, 2], nboot=10), A, B)
p1 = bar([L"$q$", L"$b$", "ymean", "ystd"], (abs.(s.S1) .+ 0.01), legend=false, title="First-Order Sensitivity Index")
p2 = bar([L"$q$", L"$b$", "ymean", "ystd"], (s.ST .+ 0.01), legend=false, yaxis=:log, title="Sensitivity Index Variances", ylimits=(0, 1))
plot(p1, p2, layout=(2,1), size=(1200, 600))Think about the joint population-economic-emissions system:
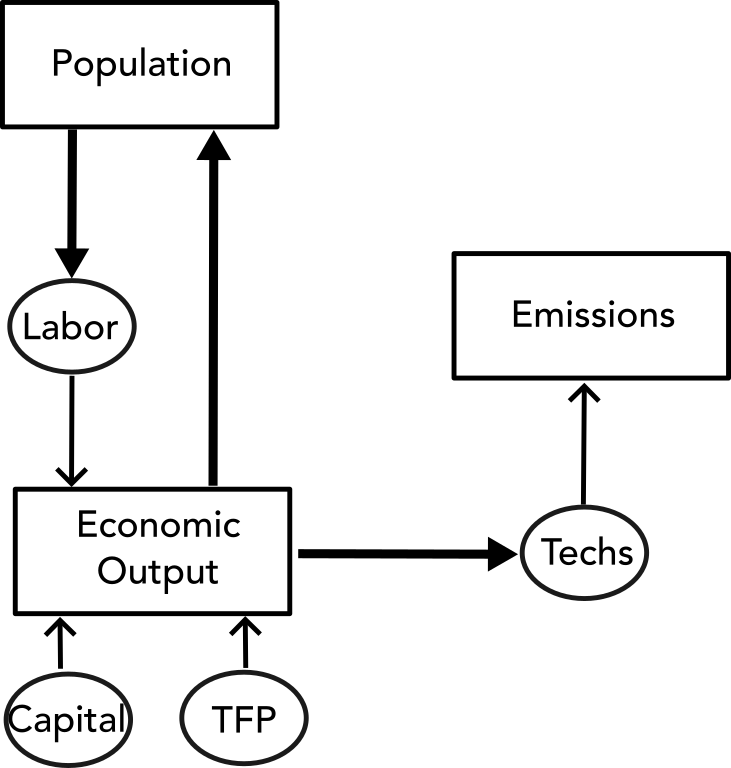

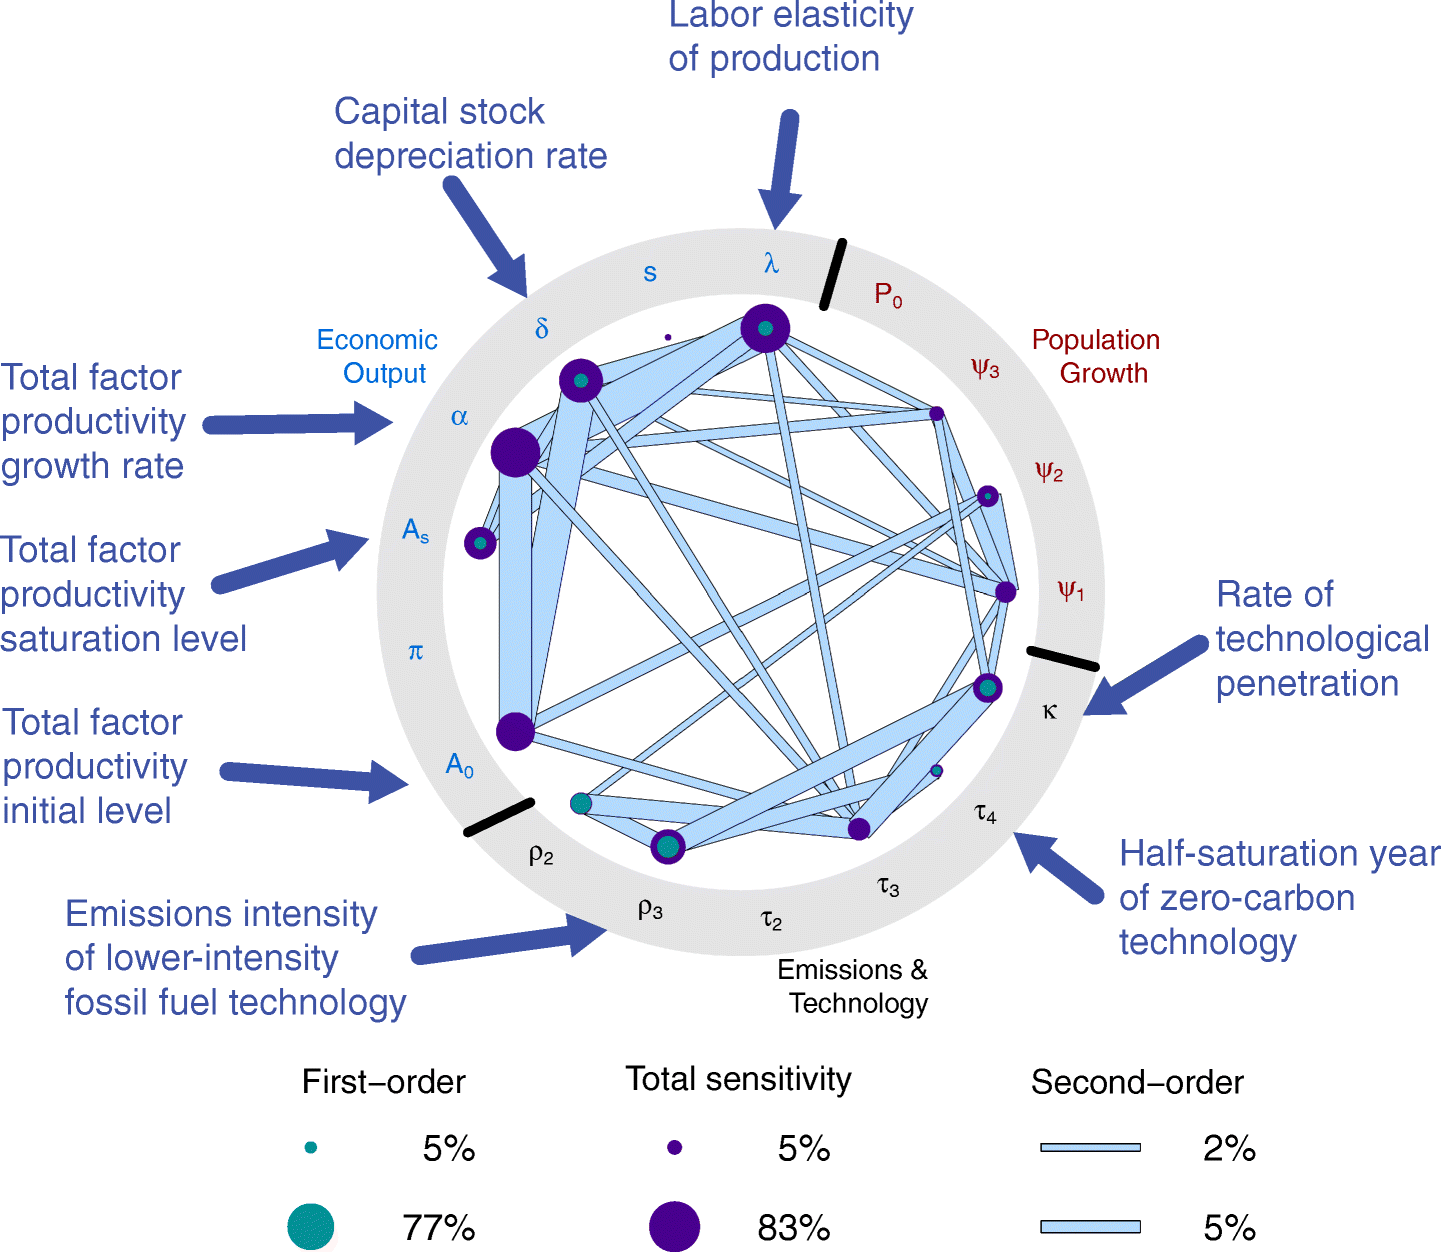
Source: Srikrishnan et al (2022)
Happy Thanksgiving!
After Break: Simulation-Optimization, no class on 12/8
HW5: Due 12/4
Projects: Take stock if you’re on track; please reach out if not!